Power spectra and sensitivity measure in microcircuit model (Bos 2016)
These examples reproduce results by Bos et al. [2016].
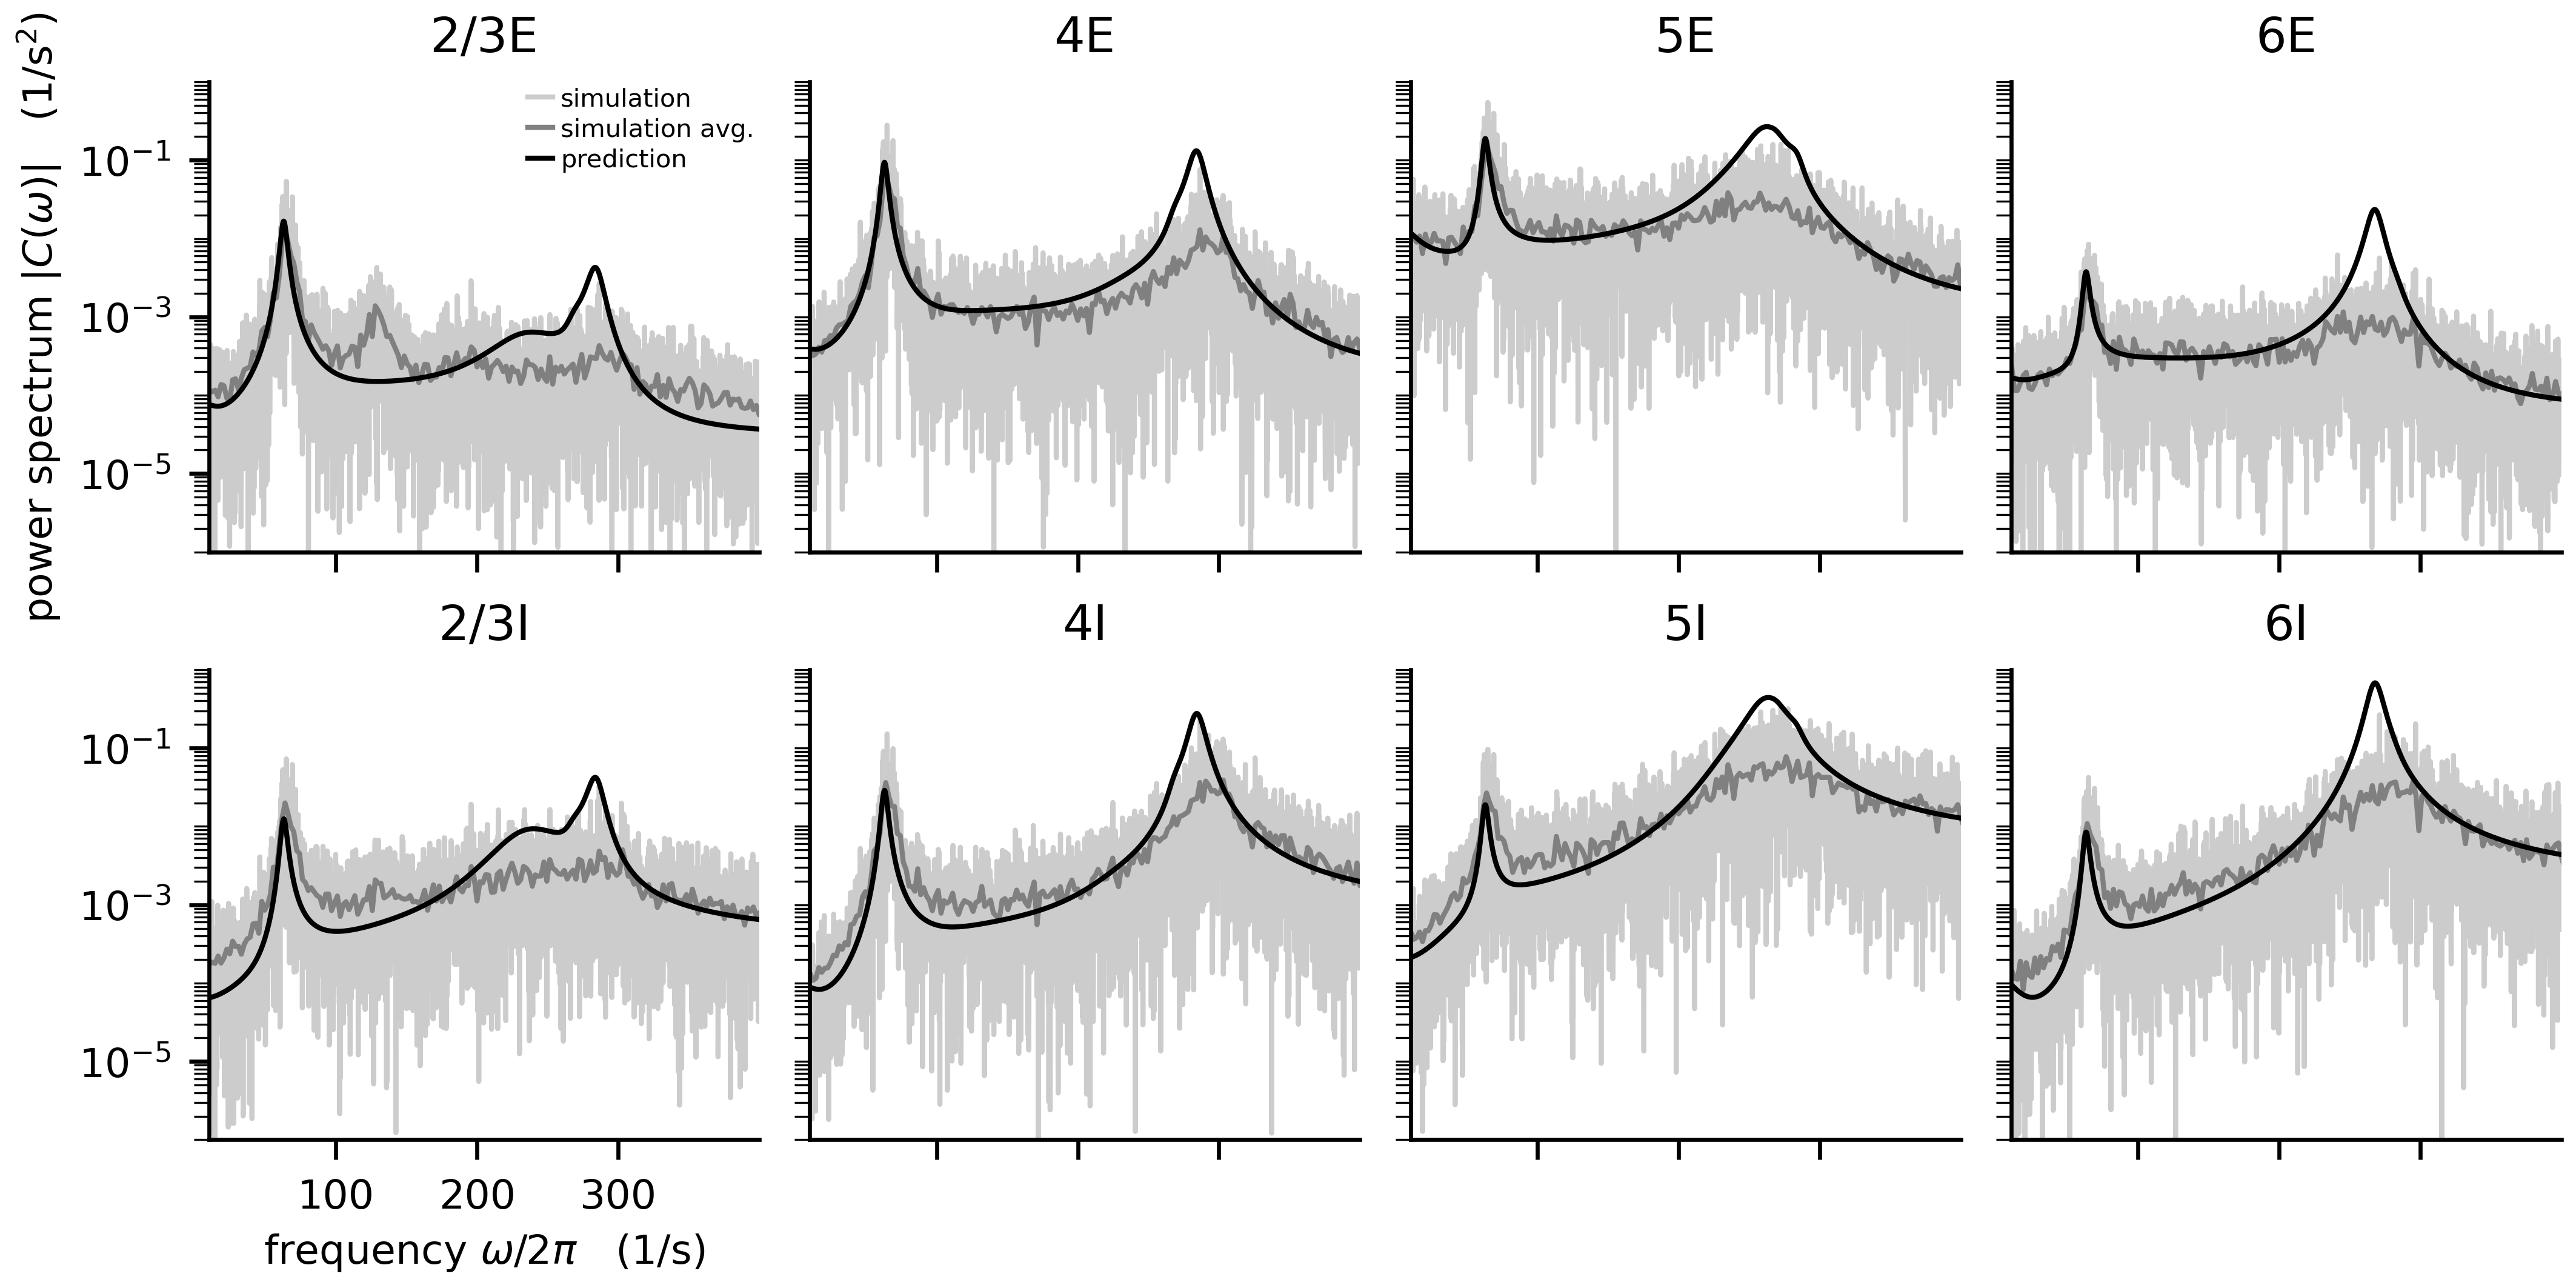
- power_spectra.py: plots the power spectra predicted by mean-field theory and compares it with simulation results (Fig 1E in Bos et al. [2016])
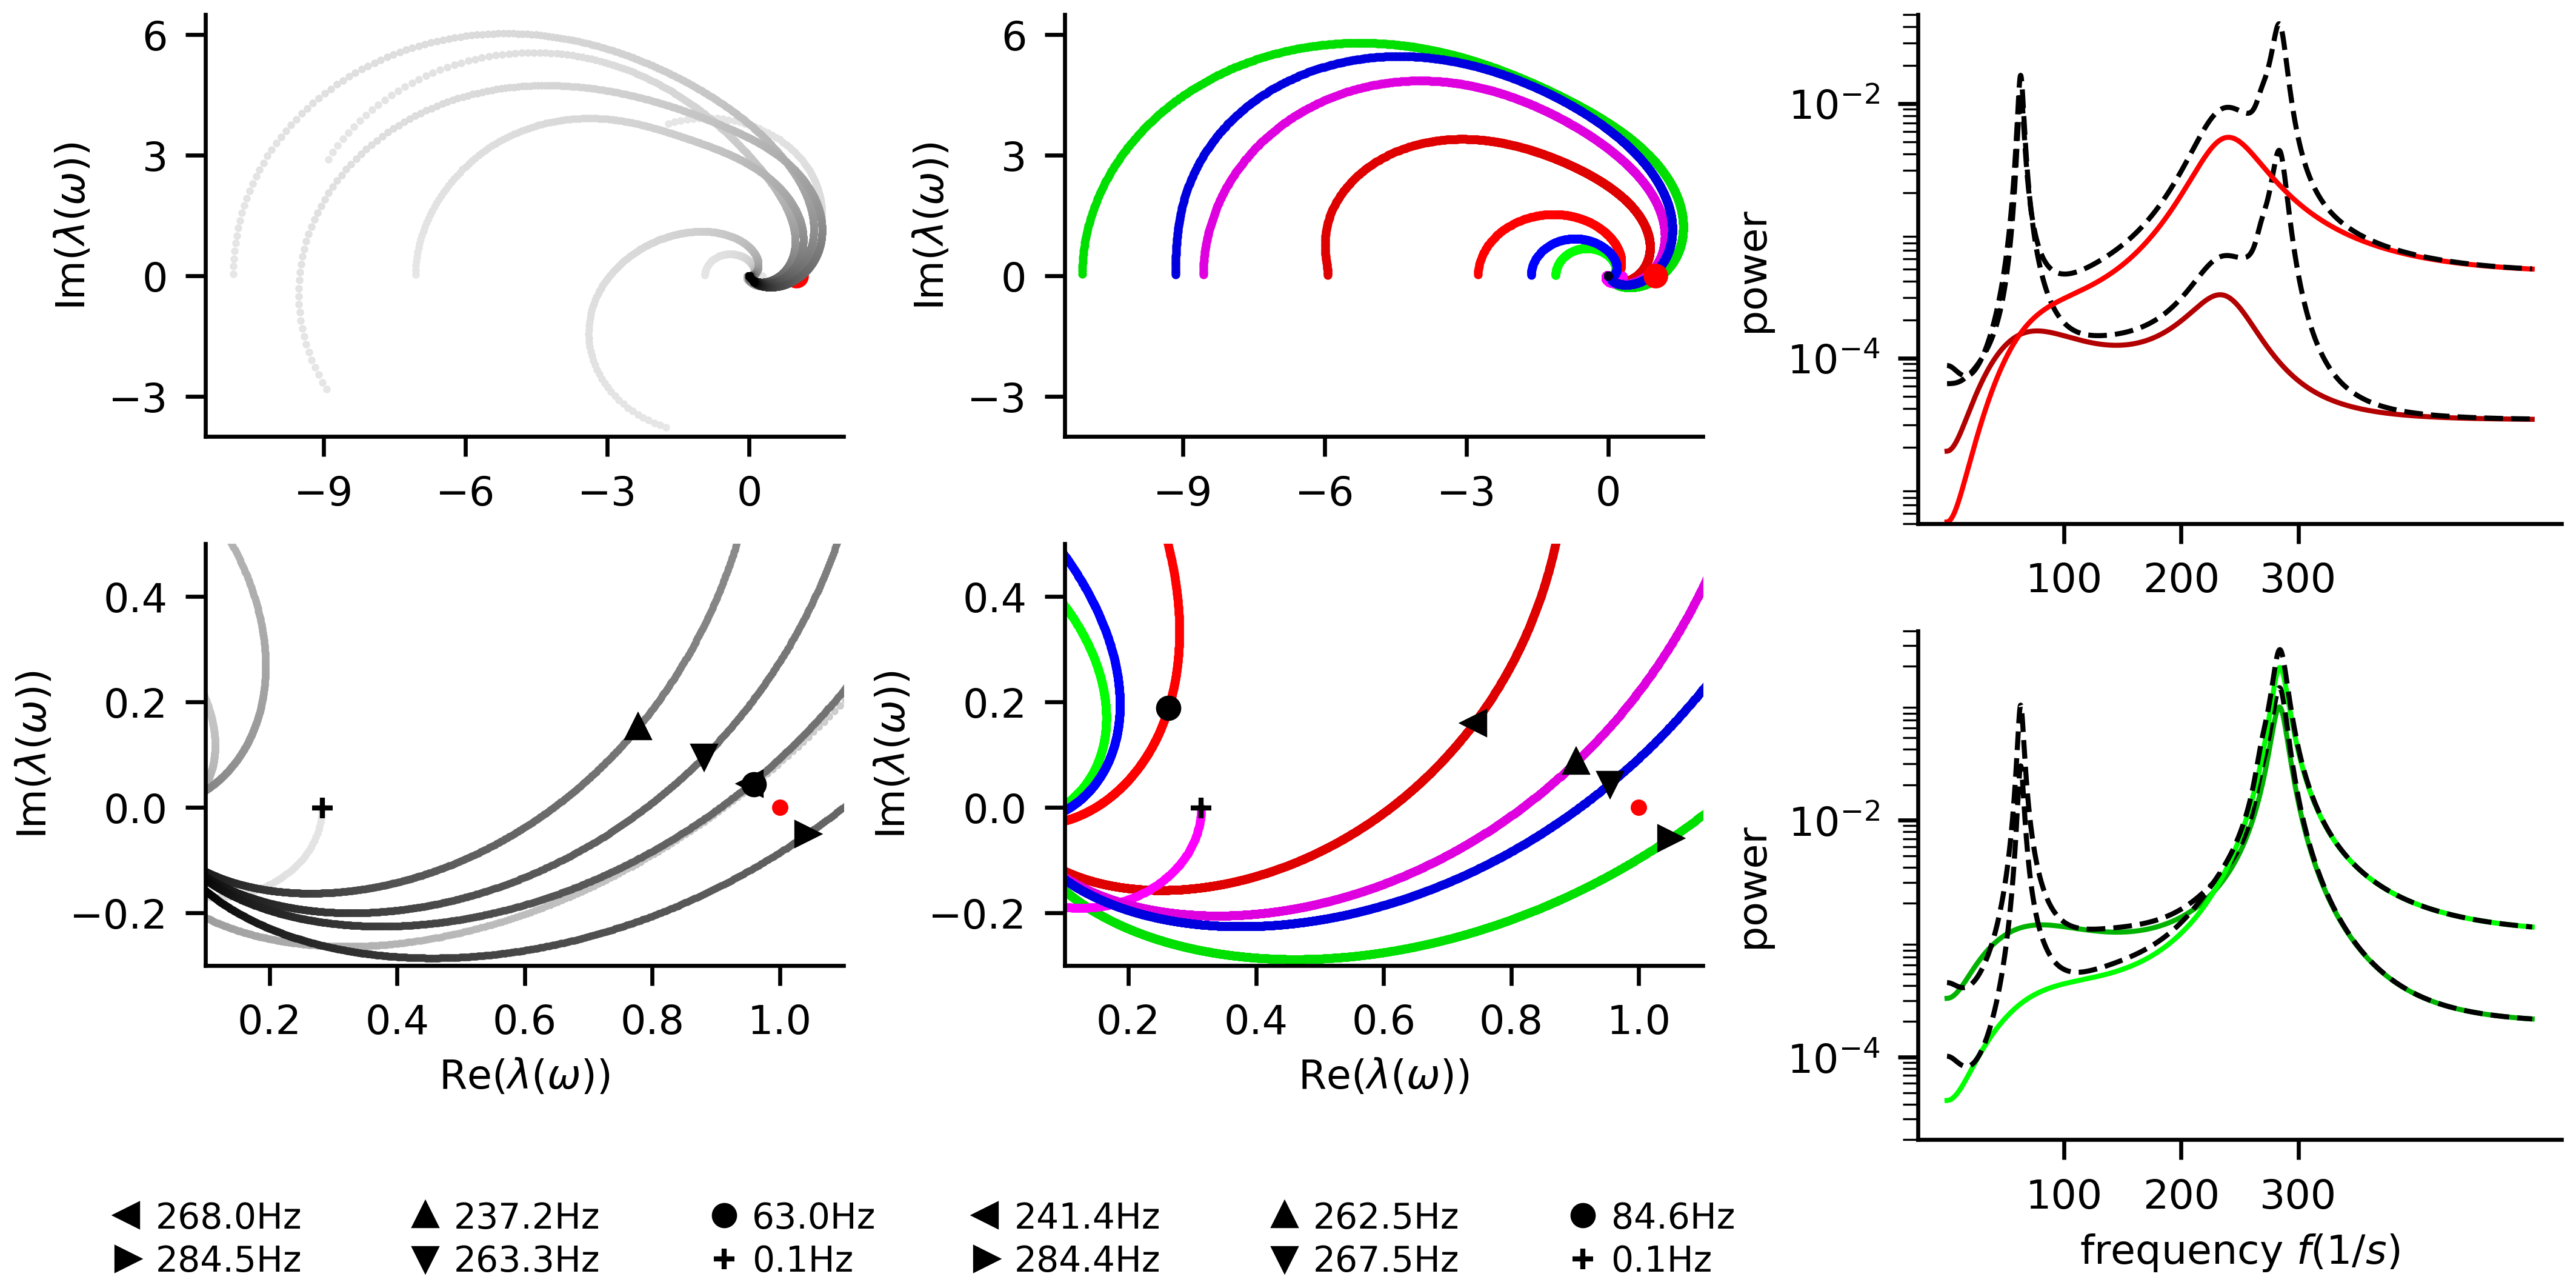
- eigenvalue_trajectories.py: calculates the eigenvalues of the effective connectivity matrix across all analysis frequencies for the whole circuit and for the isolated layers (Fig. 4 in Bos et al. [2016])
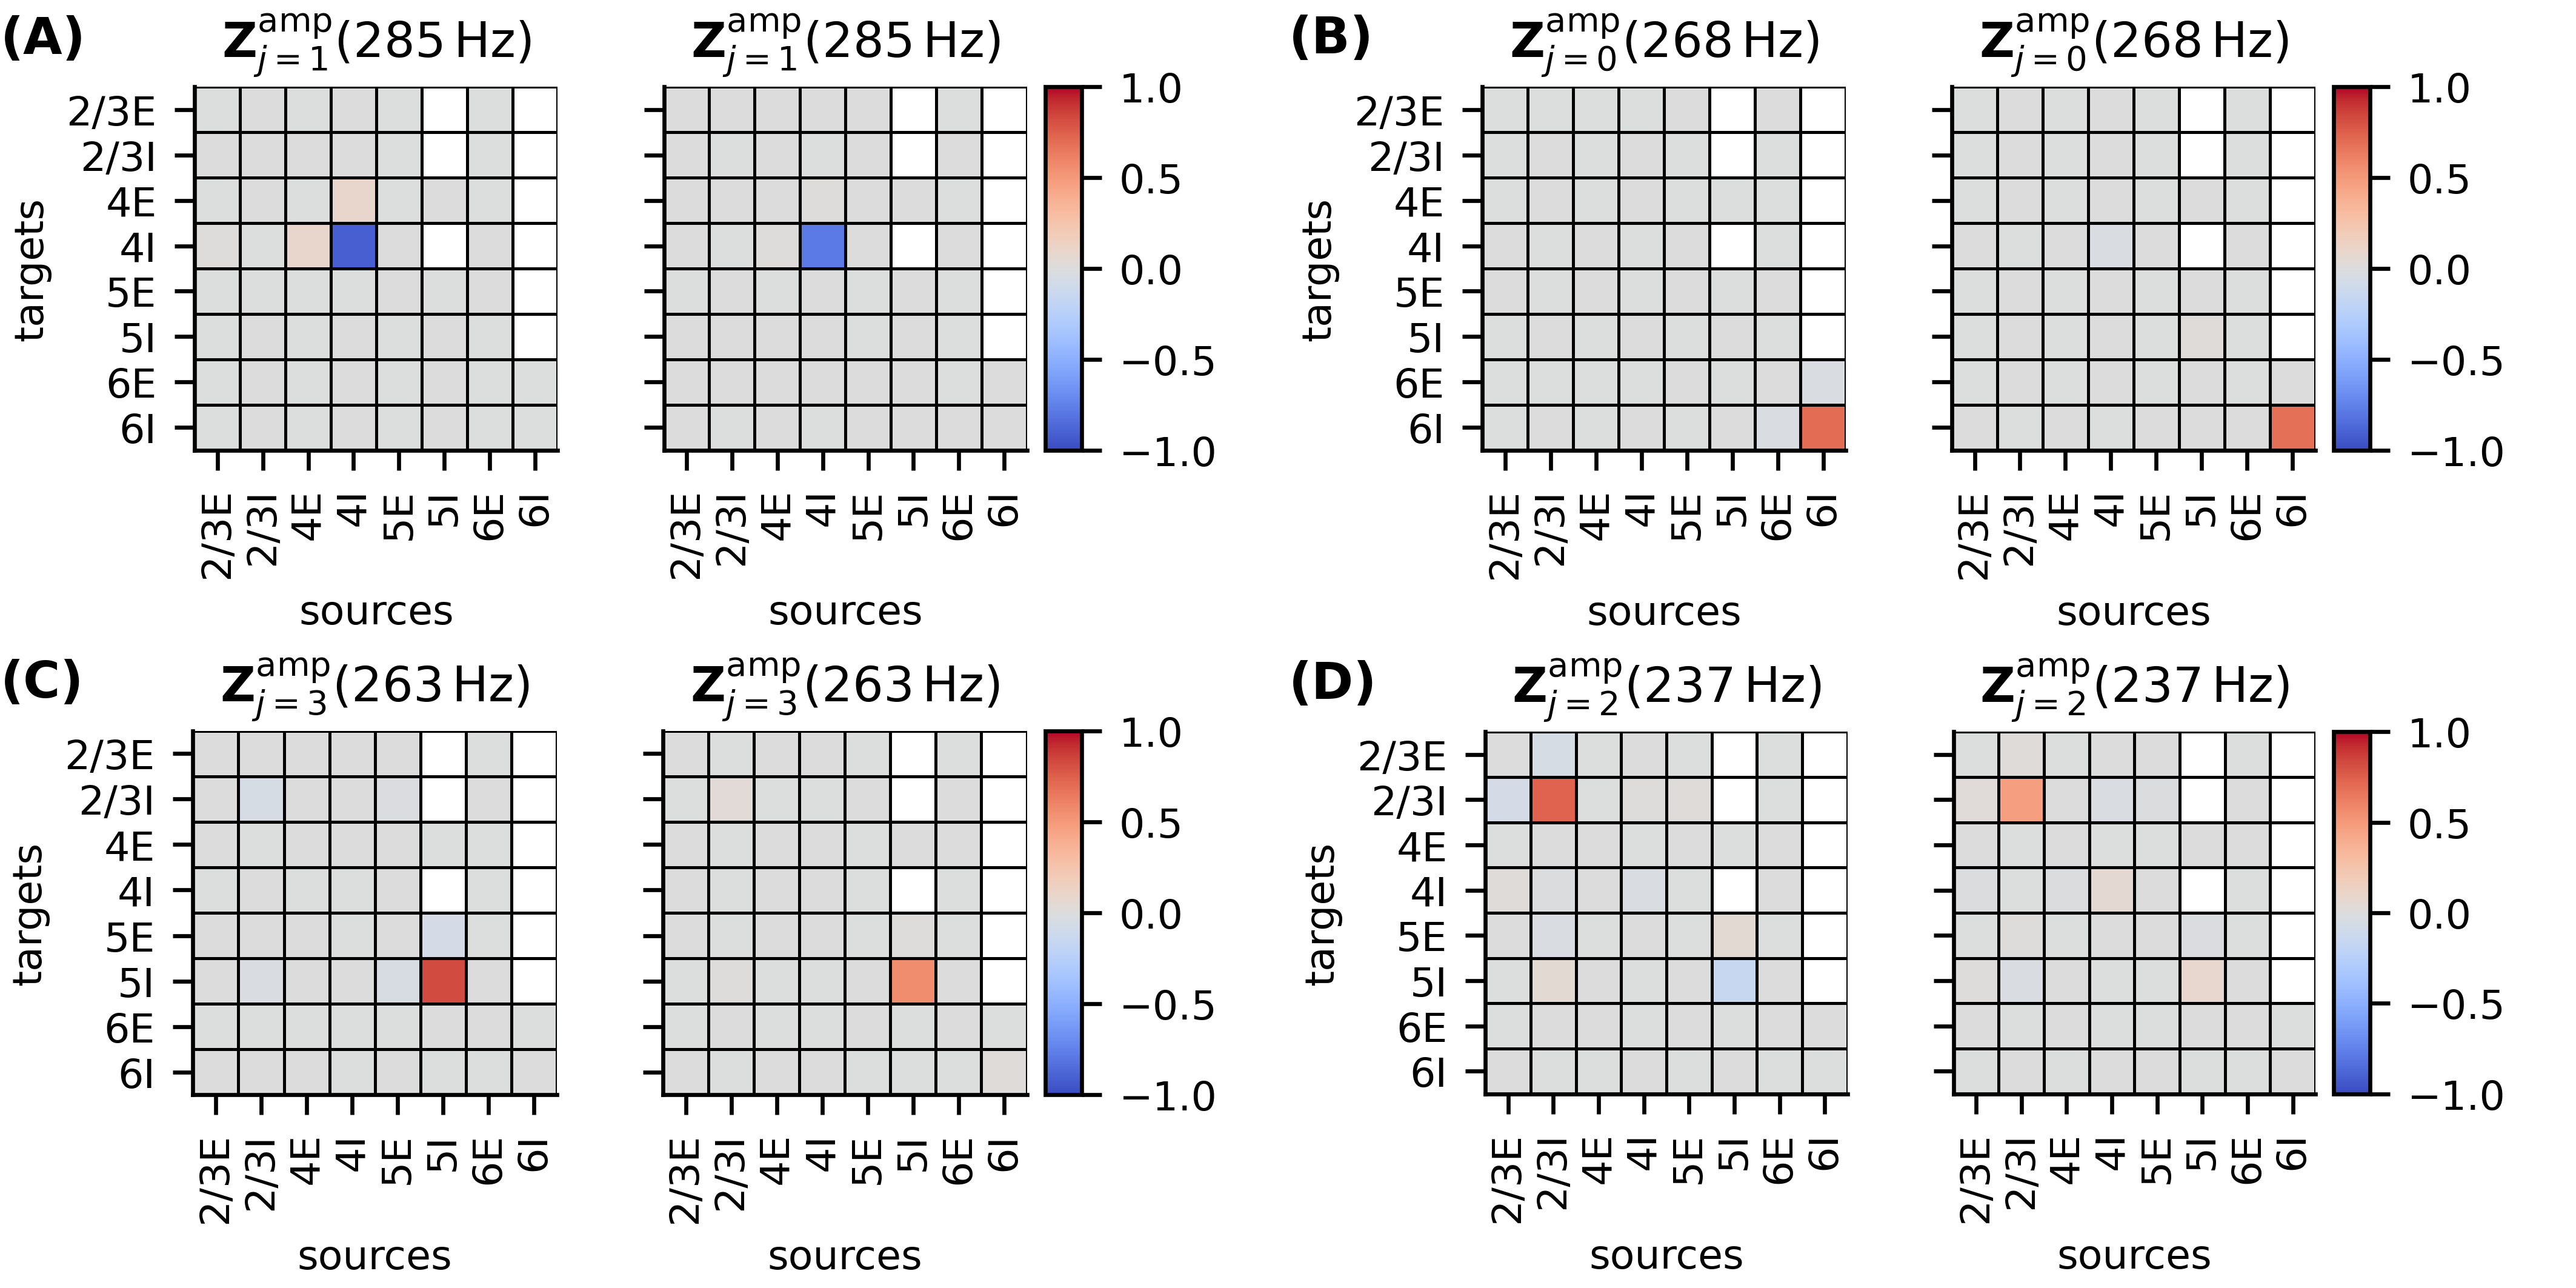
- sensitivity_measure.py: computes the sensitivity measure for each eigenmode to reveal the anatomical origin of peaks in the power spectra (Fig. 6 in Bos et al. [2016])
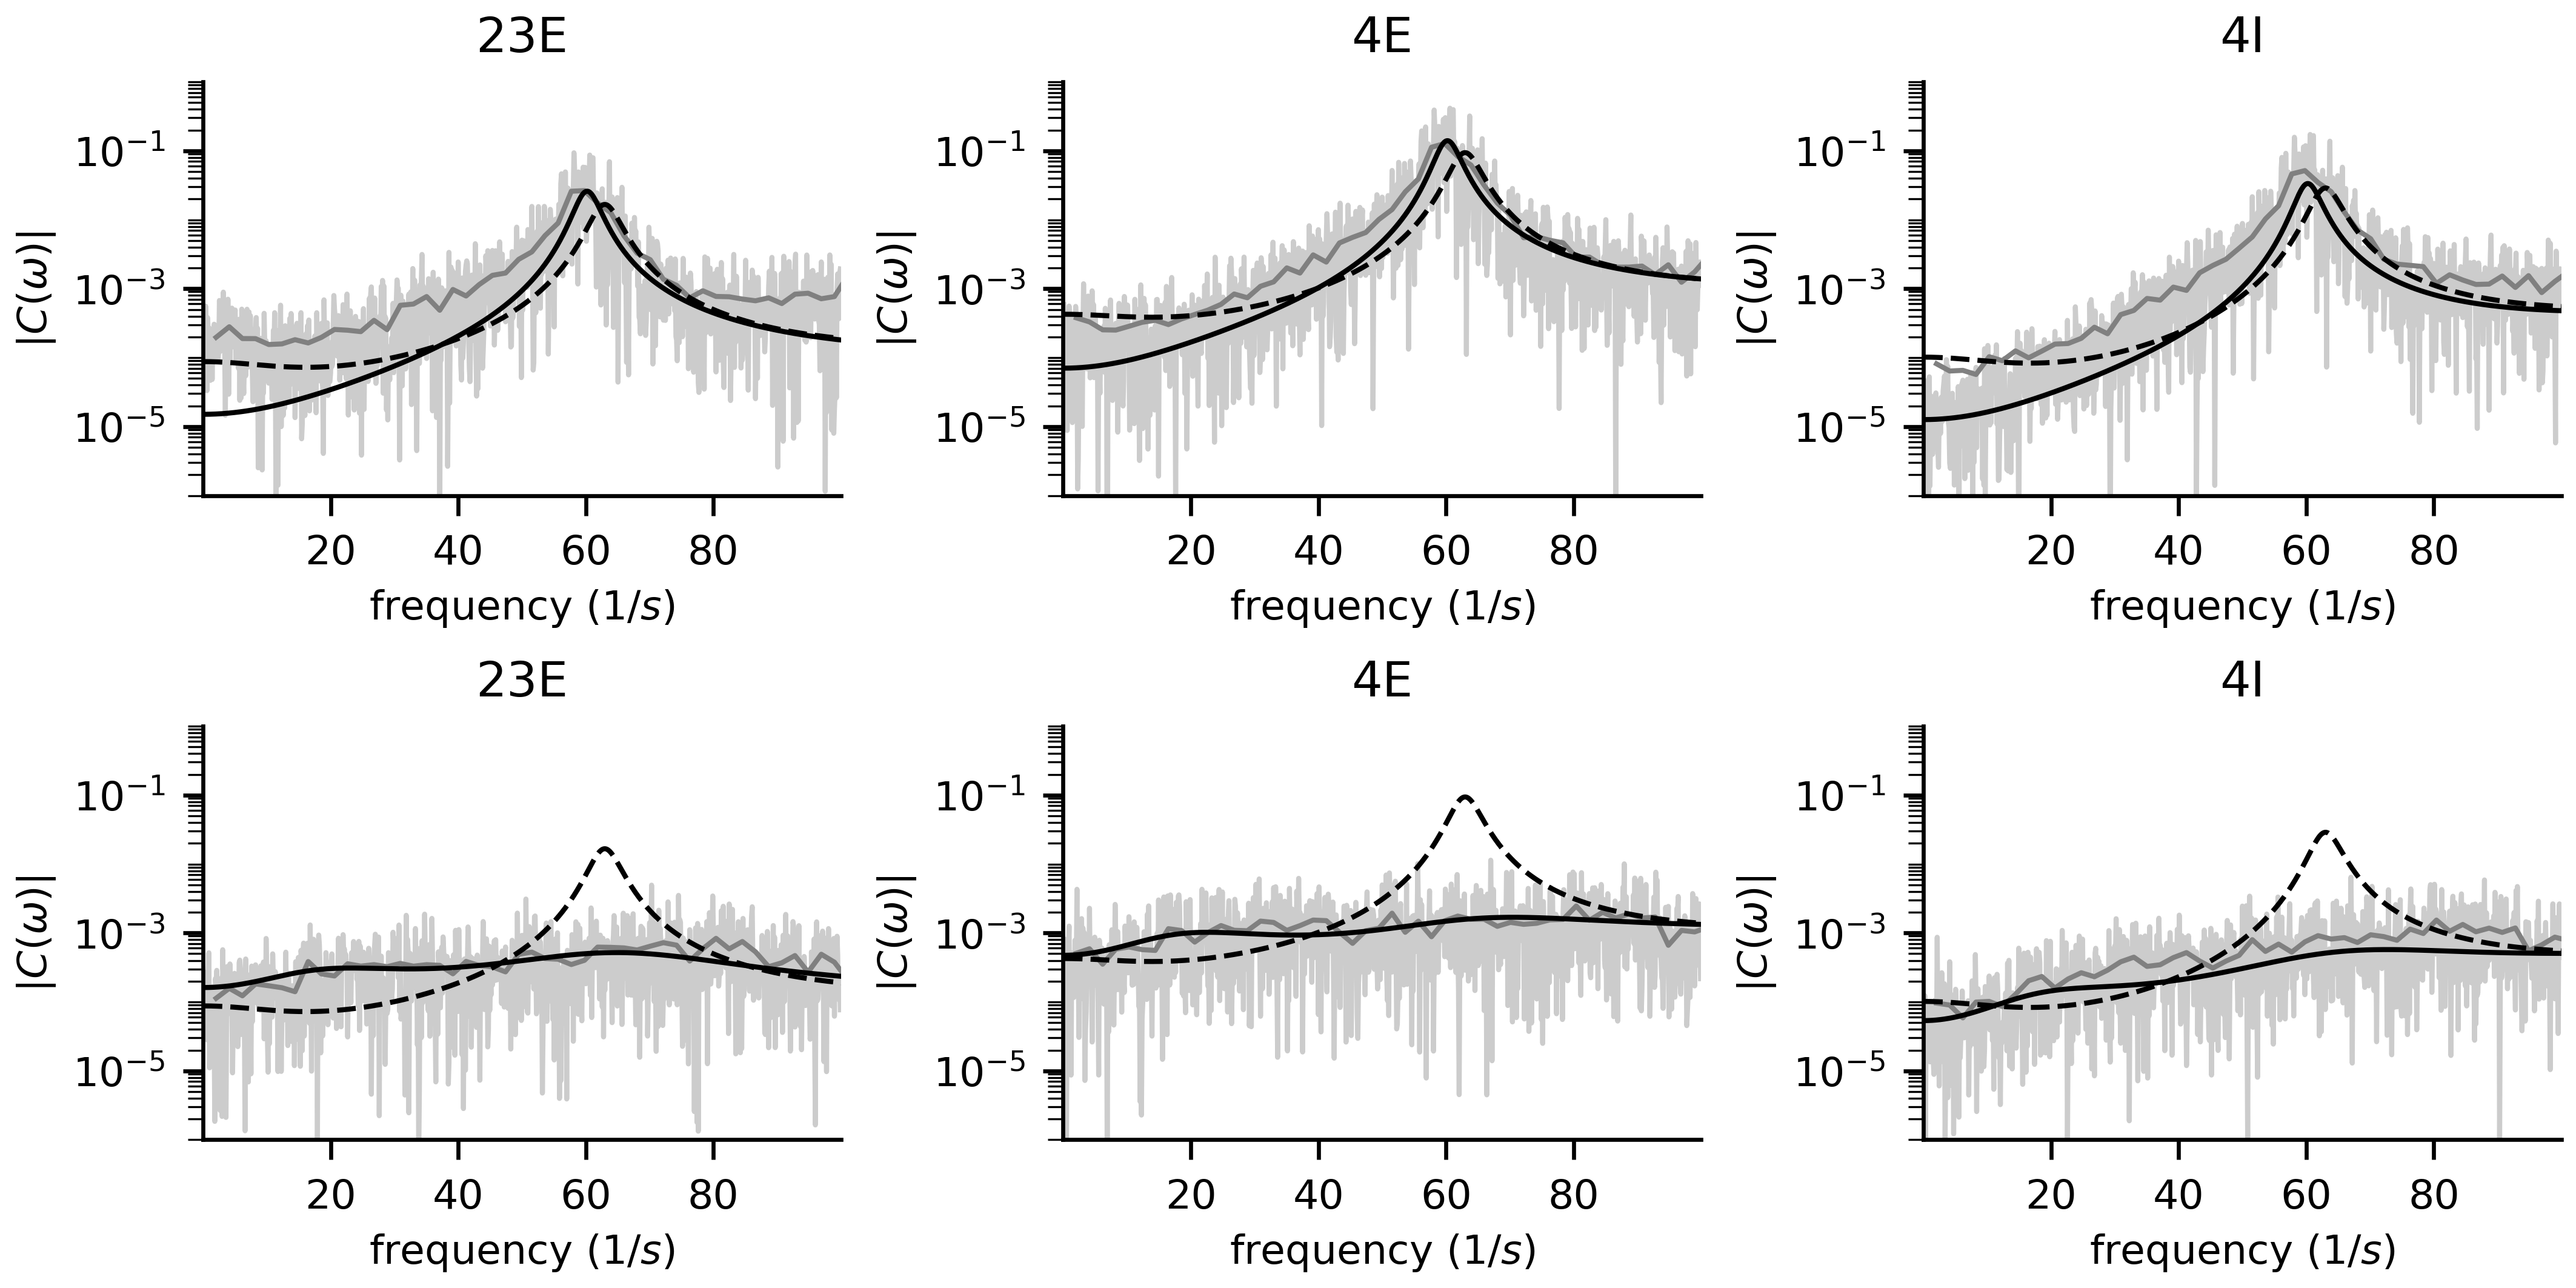
- power_spectra_of_subcircuits.py: confirms the results of the sensitivity measure for the low-$gamma$ oscillations by plotting the power spectra of the relevant subcircuits (Fig. 9 in Bos et al. [2016])
All Python scripts use the parameter files
Bos2016_network_params.yaml
and
Bos2016_analysis_params.yaml.